Machine Learning - Selected Assignments
Leadership - Artifact 4
EDTECH 597 Jupyter Leadership Machine Learning Python
2 minutes
I would be remiss not to include an artifact from my favorite course in the program. Introduction to Machine Learning Education (EDTECH 597) provided an excellent introduction to machine learning and data analysis using Python, Orange, and Jupyter Notebooks. The artifact linked below is from an exercise later in the course where various machine learning models were applied to a dataset and evaluated. Further below is a representative output from a Jupyter notebook used in the course. Machine learning is one of the most interesting applications of artificial intelligence (AI) in education with the recent exception of generative AI and large language models (LLMs).
The lessons provided from this course provided a springboard from which I was able to extend my knowledge of Python and data analysis to pursue an entirely different career. I use these tools on a daily basis as a test engineer.
Selected Machine Learning Assignment
#import necessary packages
import pandas as pd #import pandas
from sklearn.cluster import KMeans #import kmeans
import matplotlib.pyplot as plt #import matplotlib for data visualization
import warnings #ignore general warnings
warnings.filterwarnings("ignore")
df = pd.read_csv('log_processed.csv') #import processed data
#group students based on their learning behaviors. Therefore, keep learning behavior related variables
df1=df[['content_access', 'assessment_access', 'interaction_frequency', 'check_grade', 'others']]
df1 #print df1
| content_access | assessment_access | interaction_frequency | check_grade | others | |
|---|---|---|---|---|---|
| 0 | 247.0 | 144.0 | 69.0 | 75.0 | 20.0 |
| 1 | 797.0 | 209.0 | 146.0 | 141.0 | 139.0 |
| 2 | 455.0 | 1067.0 | 193.0 | 119.0 | 32.0 |
| 3 | 745.0 | 173.0 | 99.0 | 176.0 | 50.0 |
| 4 | 473.0 | 167.0 | 49.0 | 152.0 | 55.0 |
| ... | ... | ... | ... | ... | ... |
| 6743 | 0.0 | 20.0 | 0.0 | 0.0 | 0.0 |
| 6744 | 2.0 | 0.0 | 0.0 | 0.0 | 0.0 |
| 6745 | 0.0 | 0.0 | 3.0 | 0.0 | 0.0 |
| 6746 | 0.0 | 3.0 | 0.0 | 0.0 | 0.0 |
| 6747 | 0.0 | 2.0 | 0.0 | 0.0 | 0.0 |
6748 rows × 5 columns
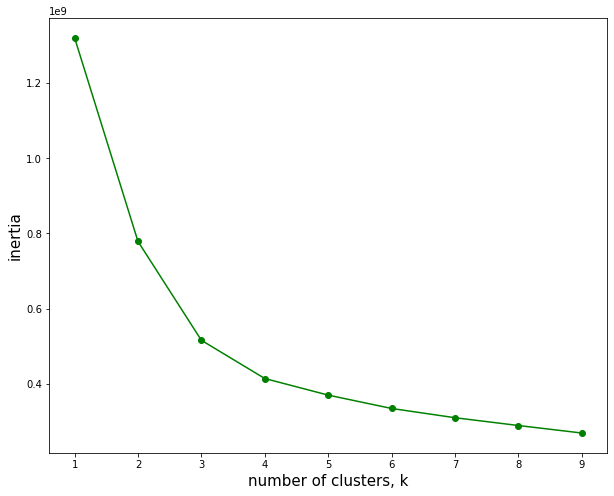
ks = range(1,10) #test clustering from 1 9 clusters 1-9
inertias = []
for k in ks:
    model = KMeans(n_clusters=k)
    model.fit(df1) # put your dataset here for running the clustering analysis
    inertias.append(model.inertia_) #append inertia_value to the list.
    #The value is the squared sum of distance between individual points with its cluster's centroid.
    #Smaller value => lower squared sum of distance with individual clusters.

plt.figure(figsize=(10,8)) #Figure size
plt.plot(ks,inertias,'-o',color='g') # x, y,style,color
plt.xlabel('number of clusters, k',size=15) #x label
plt.ylabel('inertia',size=15) #y label
plt.xticks(ks) # ticks on the X axis
plt.show() #Plot